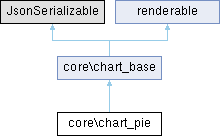
Chart pie class.
More...
|
|
bool | $doughnut = null |
| | $doughnut Whether the chart should be displayed as doughnut.
|
| |
|
string[] | $labels = [] |
| | The labels for the X axis when categorised.
|
| |
|
array | $legendoptions = [] |
| | Options for the chart legend.
|
| |
|
array | $responsiveoptions = [] |
| | Options for the chart responsiveness.
|
| |
|
chart_series[] | $series = [] |
| | The series constituting this chart.
|
| |
|
string | $title = null |
| | The title of the chart.
|
| |
|
chart_axis[] | $xaxes = [] |
| | The X axes.
|
| |
|
chart_axis[] | $yaxes = [] |
| | The Y axes.
|
| |
Chart pie class.
- Copyright
- 2016 Frédéric Massart - FMCorz.net
- License
- http://www.gnu.org/copyleft/gpl.html GNU GPL v3 or later
◆ add_series()
Add a series to the chart.
- Parameters
-
| chart_series | $serie | The serie. |
◆ get_doughnut()
| core\chart_pie::get_doughnut |
( |
| ) |
|
Get whether the chart should be displayed as doughnut.
- Return values
-
◆ get_labels()
| core\chart_base::get_labels |
( |
| ) |
|
|
inherited |
Get the labels of the X axis.
- Return values
-
◆ get_legend_options()
| core\chart_base::get_legend_options |
( |
| ) |
|
|
inherited |
Get an array of options for the chart legend.
- Return values
-
◆ get_responsive_options()
| core\chart_base::get_responsive_options |
( |
| ) |
|
|
inherited |
Get an array of responsive options for the chart.
- Return values
-
◆ get_series()
| core\chart_base::get_series |
( |
| ) |
|
|
inherited |
Get the series.
- Return values
-
◆ get_title()
| core\chart_base::get_title |
( |
| ) |
|
|
inherited |
Get the title.
- Return values
-
◆ get_type()
| core\chart_base::get_type |
( |
| ) |
|
|
inherited |
Get the chart type.
- Return values
-
◆ get_xaxes()
| core\chart_base::get_xaxes |
( |
| ) |
|
|
inherited |
Get the X axes.
- Return values
-
◆ get_xaxis()
| core\chart_base::get_xaxis |
( |
| $index = 0, |
|
|
| $createifnotexists = false ) |
|
inherited |
Get an X axis.
- Parameters
-
| int | $index | The index of the axis. |
| bool | $createifnotexists | When true, create an instance of the axis if none exist at this index yet. |
- Return values
-
◆ get_yaxes()
| core\chart_base::get_yaxes |
( |
| ) |
|
|
inherited |
Get the Y axes.
- Return values
-
◆ get_yaxis()
| core\chart_base::get_yaxis |
( |
| $index = 0, |
|
|
| $createifnotexists = false ) |
|
inherited |
Get a Y axis.
- Parameters
-
| int | $index | The index of the axis. |
| bool | $createifnotexists | When true, create an instance of the axis if none exist at this index yet. |
- Return values
-
◆ jsonSerialize()
| core\chart_pie::jsonSerialize |
( |
| ) |
|
Get parent JSON and add specific pie related attributes and values.
- Return values
-
Reimplemented from core\chart_base.
◆ set_defaults()
| core\chart_base::set_defaults |
( |
| ) |
|
|
protectedinherited |
Set the defaults for this chart type.
Child classes can extend this to set default values on instantiation.
In general the constructor could be used, but this method is here to emphasize and self-document the default values set by the chart type.
- Return values
-
Reimplemented in core\chart_bar.
◆ set_doughnut()
| core\chart_pie::set_doughnut |
( |
| $doughnut | ) |
|
Set whether the chart should be displayed as doughnut.
- Parameters
-
| bool | $doughnut | True for doughnut type, false for pie. |
◆ set_labels()
| core\chart_base::set_labels |
( |
array | $labels | ) |
|
|
inherited |
Set the chart labels.
- Parameters
-
| string[] | $labels | The labels. |
◆ set_legend_options()
| core\chart_base::set_legend_options |
( |
array | $legendoptions | ) |
|
|
inherited |
Set options for the chart legend.
See https://www.chartjs.org/docs/2.7.0/configuration/legend.html for options.
Note: Setting onClick and onHover events is not directly supported through this method. These config options must be set directly within Javascript on the page.
- Parameters
-
| array | $legendoptions | Whether or not to display the chart's legend. |
◆ set_responsive_options()
| core\chart_base::set_responsive_options |
( |
array | $responsiveoptions | ) |
|
|
inherited |
◆ set_title()
| core\chart_base::set_title |
( |
| $title | ) |
|
|
inherited |
Set the title.
- Parameters
-
◆ set_xaxis()
| core\chart_base::set_xaxis |
( |
chart_axis | $axis, |
|
|
| $index = 0 ) |
|
inherited |
Set an X axis.
Note that this will override any predefined axis without warning.
- Parameters
-
| chart_axis | $axis | The axis. |
| int | $index | The index of the axis. |
◆ set_yaxis()
| core\chart_base::set_yaxis |
( |
chart_axis | $axis, |
|
|
| $index = 0 ) |
|
inherited |
Set an Y axis.
Note that this will override any predefined axis without warning.
- Parameters
-
| chart_axis | $axis | The axis. |
| int | $index | The index of the axis. |
◆ validate_axis()
| core\chart_base::validate_axis |
( |
| $xy, |
|
|
chart_axis | $axis, |
|
|
| $index = 0 ) |
|
protectedinherited |
Validate an axis.
We validate this from PHP because not doing it here could result in errors being hard to trace down. For instance, if we were to add axis at keys without another axis preceding, we would effectively contain the axes in an associative array rather than a simple array, and that would have consequences on serialisation.
- Parameters
-
| string | $xy | Accepts x or y. |
| chart_axis | $axis | The axis to validate. |
| index | $index | The index of the axis. |
The documentation for this class was generated from the following file:
- lib/classes/chart_pie.php